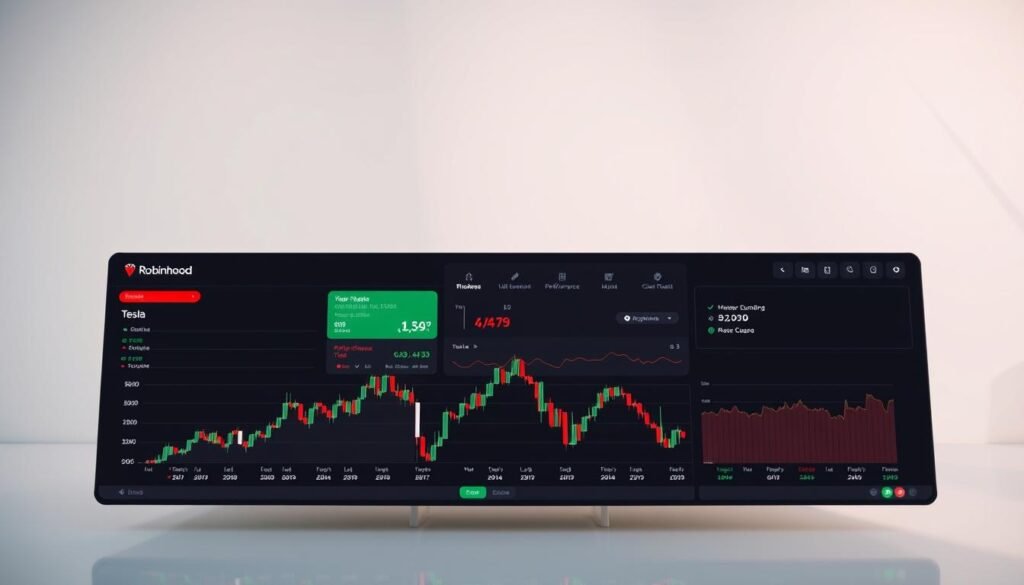
Robinhood Tesla Stock Price: Current Quotes and Trends
Ever wondered how one of the most talked-about companies in the market performs on a trading platform designed for modern investors? With real-time data and extended trading hours, keeping up with equity movements has never been easier.
Currently trading in the $348 range, this high-growth player shows significant volatility, with a 52-week swing between $182 and $488.54. Its massive mkt cap of $1.123T places it among the top S&P 500 leaders, reflecting strong investor confidence.
Unique features like 24/5 trading access allow flexibility for those tracking rapid price shifts. Whether you’re analyzing bid-ask spreads or long-term trends, understanding these dynamics is key for strategic decisions.
Key Takeaways
- Real-time trading data highlights intraday volatility.
- Extended trading hours offer flexibility for investors.
- Current price sits between a wide 52-week range.
- $1.12T market cap reflects strong market presence.
- High beta indicates sensitivity to market swings.
Tesla Stock Performance on Robinhood

Tracking the performance of high-growth equities requires real-time insights. Platforms like Robinhood provide tools to monitor price movements, volume trends, and extended trading windows. This section breaks down key metrics and trading dynamics.
Real-Time Price and Trading Hours
Robinhood offers pre-market (4AM–9:30AM ET) and after-hours (4PM–8PM ET) sessions. These extended windows cater to investors reacting to news like robotaxi announcements, which recently drove volume to 186M shares—48% above average.
- Zero commissions on trades, ideal for frequent adjustments.
- Average daily liquidity of $121.56M supports tight bid-ask spreads.
- Options activity (calls/puts) often amplifies intraday volatility.
Historical Performance Trends
Over the past year, this equity saw a -34% return, contrasting with the S&P 500’s +15% gain. However, its 5-year return of +580% highlights long-term potential. Tools like Robinhood’s charting features simplify trend analysis.
“High-beta stocks demand disciplined entry/exit strategies.”
After-Hours and Risk Factors
With a beta of 2.46—more than double the market average—price swings are common. Institutional ownership shifts and tax implications for short-term trades add layers of complexity. Compare this to Ford’s beta of 1.2 for sector context.
- Monitor volume spikes during earnings or product launches.
- Use limit orders to manage after-hours volatility.
- Review tax liabilities for frequent trading.
Tesla Stock Key Metrics and Statistics

Understanding key financial metrics helps investors gauge long-term potential. From valuation ratios to revenue streams, these figures reveal strengths and risks. Let’s break down the numbers shaping investment decisions.
Market Cap and P/E Ratio
The $1.12T market cap dwarfs many S&P 500 peers, reflecting its dominance in energy and tech. Yet, its P/E ratio of 177.17 sparks debate—nearly 10x the sector average. Analysts argue this premium hinges on future generation growth, not current earnings.
Enterprise value ($1.01T) accounts for debt and cash, offering a clearer picture. With $37B liquidity against $17.4B debt, the balance sheet supports aggressive R&D spending.
52-Week High/Low and Volume
Price swings between $182 and $488.54 highlight volatility. Currently trading 30% below its peak, the weekly volume averages 186M shares—48% above norm. Short interest (18.5% of float) amplifies fluctuations, especially during revenue announcements.
“High valuations demand proof of sustained execution.” — Market Analyst
Dividend Yield and Analyst Ratings
Unlike legacy automakers, this company offers no dividend yield, reinvesting profits into expansion. Its cash flow fuels sales growth, with 78% from automotive and 15% from regulatory credits.
Analysts remain split: 24 recommend Buy, 18 Hold, and 12 Sell. The average 1-year target ($227.26) suggests caution, but the energy segment’s 20% revenue share could sway sentiment.
Market Trends and Tesla’s Positioning
The electric vehicle sector is transforming rapidly, reshaping market dynamics. From battery breakthroughs to regulatory shifts, companies must adapt to stay competitive. This section explores key trends and how one innovator navigates these changes.
Electric Vehicle Industry Outlook
Global EV adoption hit record highs in 2024, with China leading at 35% and the U.S. at 18%. Battery costs dropped 22% year-to-date, boosting affordability. Energy storage solutions, like Tesla’s 85% growth segment, are becoming profit drivers.
Legacy automakers face hurdles. GM’s Ultium platform trails in efficiency, while Ford’s Mach-E sales grew 45%—outpacing Model Y’s 12%. Vertical integration gives some firms an edge in scaling production.
Recent News Impacting Performance
SpaceX’s rocket failures briefly dampened investor sentiment, highlighting intertwined risks. Meanwhile, the robotaxi race heats up. Waymo operates 100+ autonomous vehicles, but Tesla’s incremental Austin rollout targets real-world data refinement.
“Autonomy isn’t a sprint; it’s about scalable safety.” — Mobility Analyst
Competitor Analysis
Chinese rivals like BYD and NIO dominate local markets with cheaper models. Tesla’s India entry (2025) could offset slowing sales elsewhere. Regulatory risks loom, including EU tariffs and U.S. tax credit changes.
- Vertical integration: Gigacasting cuts production costs by 30%.
- Energy services: Storage deployments rose 200% in Q2.
- Cash reserves: $37B cushions R&D spends amid rate hikes.
Conclusion
High-growth equities like this one offer both opportunity and risk. With a mkt cap exceeding $1T, it remains a dominant player in the S&P 500, but its volatility demands careful strategy.
For investors, tools like technical charts and dollar-cost averaging can help manage swings. Upcoming catalysts, including earnings and AI developments, may drive short-term moves.
Diversification is key—compare its return potential to broader market ETFs. While some analysts project long-term gains, concentration risk in tech-heavy portfolios warrants caution.
Use educational services to refine your approach. Whether building a position or adjusting allocations, staying informed is critical in fast-moving companies.

